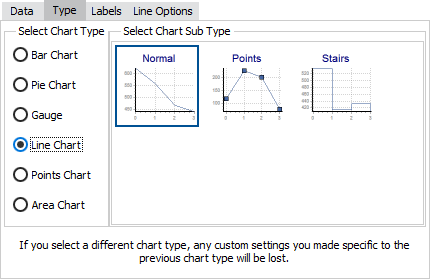
Chart Wizard - Line Chart Properties
Line charts are useful for showing data in a more linear fashion. This chart type in especially useful in showing data points or trends over time.
After you have selected a line chart from the list of chart types on the Type tab, you can then select a chart sub-type and configure various chart options.
Line Chart Sub-Types
The chart sub-type determines how the line for the selected series will appear.

![]()
Classic charts give you three line options:
- Normal - Draws a line following the data points using interpolation (or intermediate values). While it does plot the data points, this type does not show the data points.
- Points - Draws the same line as the Normal subtype, but this one shows the data points on the line.
- Stairs - Does not interpolate between data points, as the normal and points subtypes do. Instead, the stairs subtype draws a horizontal line to the X value of the next data point, then draws a vertical line (or step) to the Y value of that data point. This results in a stair step look for this subtype.
Standard charts support only the Points sub-type.
Line Chart Options
The Line Options tab provides some additional configuration options for line charts:

- Horizontal - Classic charts only. Checking this box switches the axis so that the line is displayed vertically instead of horizontally.
- Color - Choose a color for the line for the selected series.
See also: Configuring Series Labels